Level 1 · Discover
You learn how to read the main screen and how to find your sites. You make no change at this level.
1.1 Sign in and read the dashboard
- Sign in to the panel and choose the language.
- Read the cards of the dashboard.
- Recognize the items of the top bar.
- Open the address of your panel, which Kokiris gives you, enter your Username and your Password, then click Sign In.
- The panel shows in the language of your browser. To change it, click the 🇫🇷 or 🇺🇸 flag at the top right: your browser keeps this choice.
- Choose the observation period: 1h, 6h, 12h or 24h.
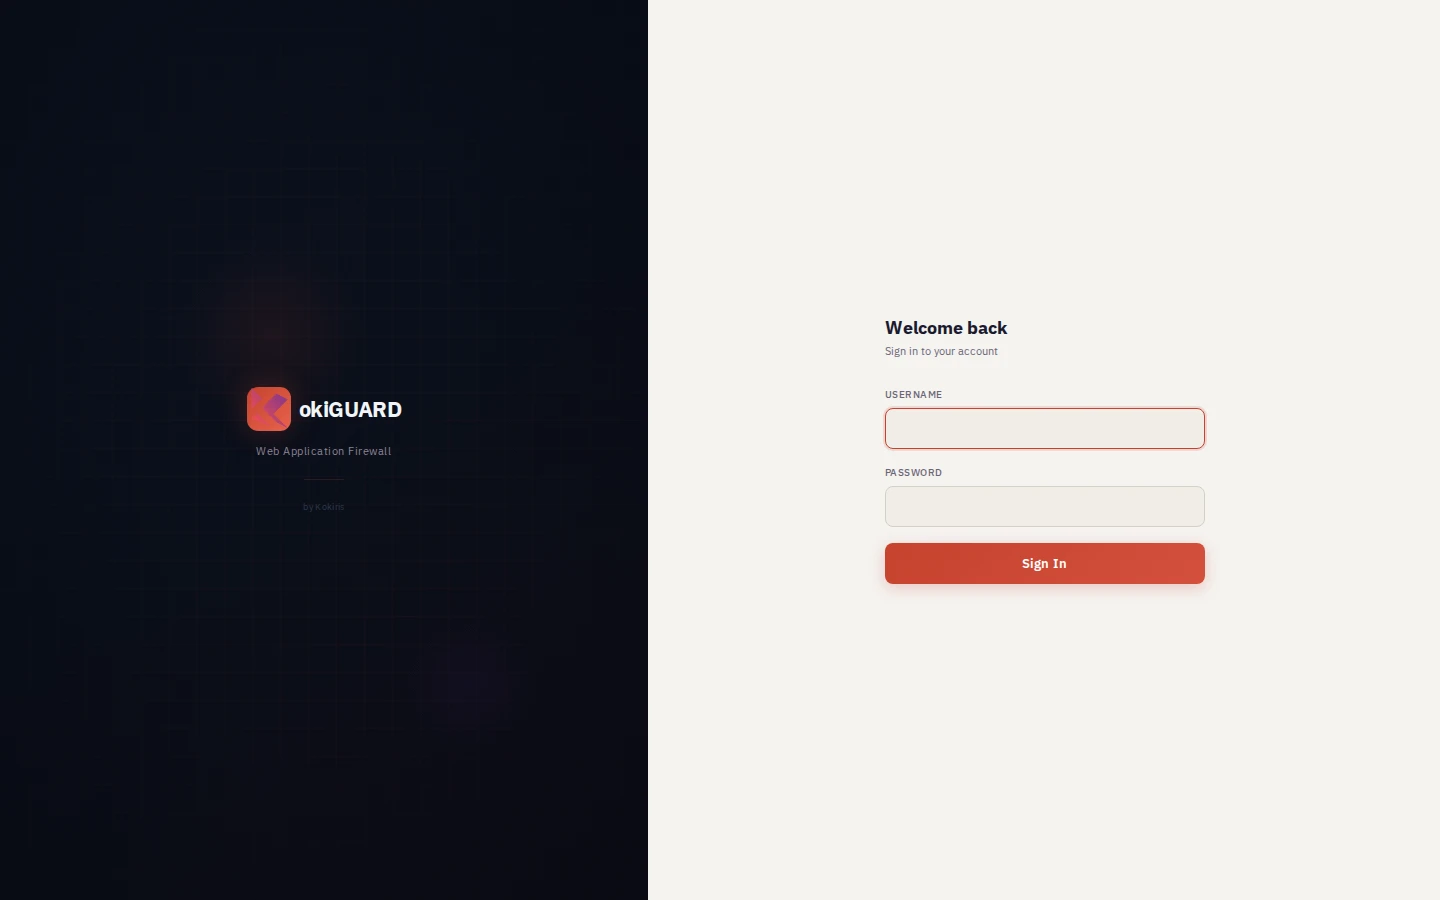
Sign-in screen. It shows in French if your browser is set to French, otherwise in English, or in the language that you chose last time with the flags.
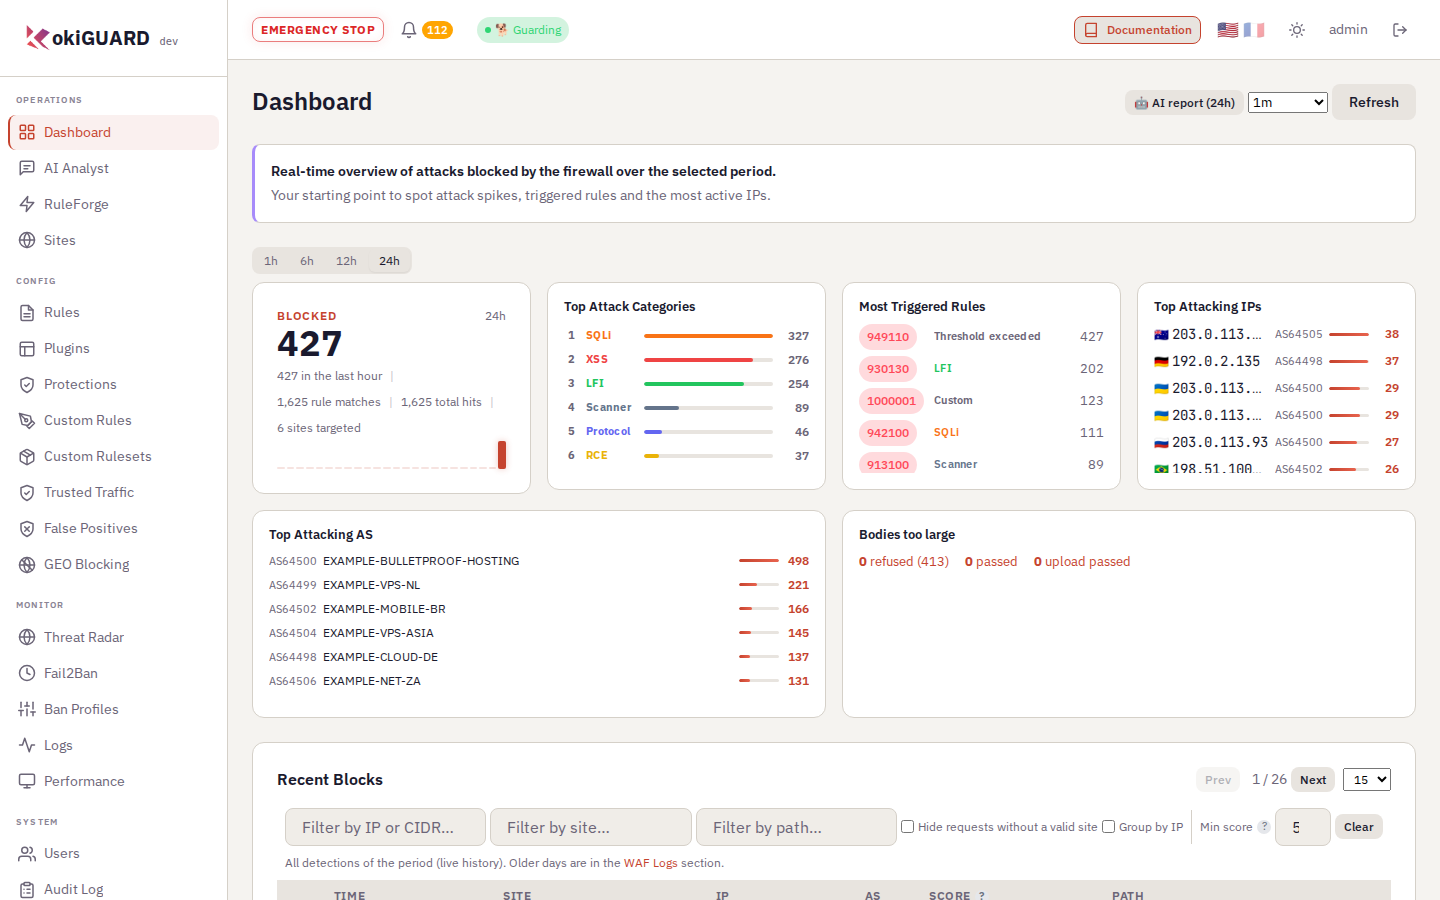
Dashboard. In a few hours, robots already tried to read sensitive files and to inject code: each card tells you what, from where, and by which rule.
What you see
| Area | What it shows |
|---|---|
| Blocked | Number of requests blocked over the period, with a small chart. |
| Top Attack Categories | The families of attacks detected: file reading (LFI), protocol, XSS, scanner… |
| Most Triggered Rules | The ids of the rules that react the most, per node or for the full cluster. |
| Top Attacking IPs | The addresses with the most detections, with their network (AS). |
| Top Attacking AS | The networks (hosting providers, operators, cloud providers) from which the most detections come. One click opens the network in the threat radar (chapter 4.2). |
| Bodies too large | The uploads that are larger than the inspected size: refused, passed or file uploads, and the paths that are affected the most (chapter 3.3). |
| Recent Blocks | The details, request by request, for the full period that you chose. You can filter by IP, site, path and minimum score. Next to the score, the outcome of the request: BLOCKED, or the HTTP code that the site sent when the request got through. The AS of each address has its own column. |
A reseller or member account sees the same dashboard, limited to its sites.
The top bar
- Emergency stop: puts all sites in detection only (see chapter 4.3). This button appears only for an account that has this right, normally an administrator.
- The bell: counts the new Kokiris protections that you did not see yet.
- 🐕 Guarding: the status of kokiGUARD. When you hover over it, it shows the status of HAProxy, Coraza and the database.
- Documentation: opens this guide in a new tab.
- Connected to node-1: the cluster node that answers you.
By default, it closes after 8 hours without activity, and in all cases 24 hours after you sign in, even if you are working in it. Sign in again: you come back to the page where you were. You can also use the panel on a phone: the tables scroll inside their card.
You want to know which IP address attacks your sites the most since this morning. Where do you look?
1.2 Find your sites
- Understand where the sites in the list come from.
- Read the WAF status of each site.
The Sites page lists each protected domain. kokiGUARD reads the Apache configurations of the server and automatically adds the sites that it finds there. Thus a site that Kokiris hosts appears without an action from you.
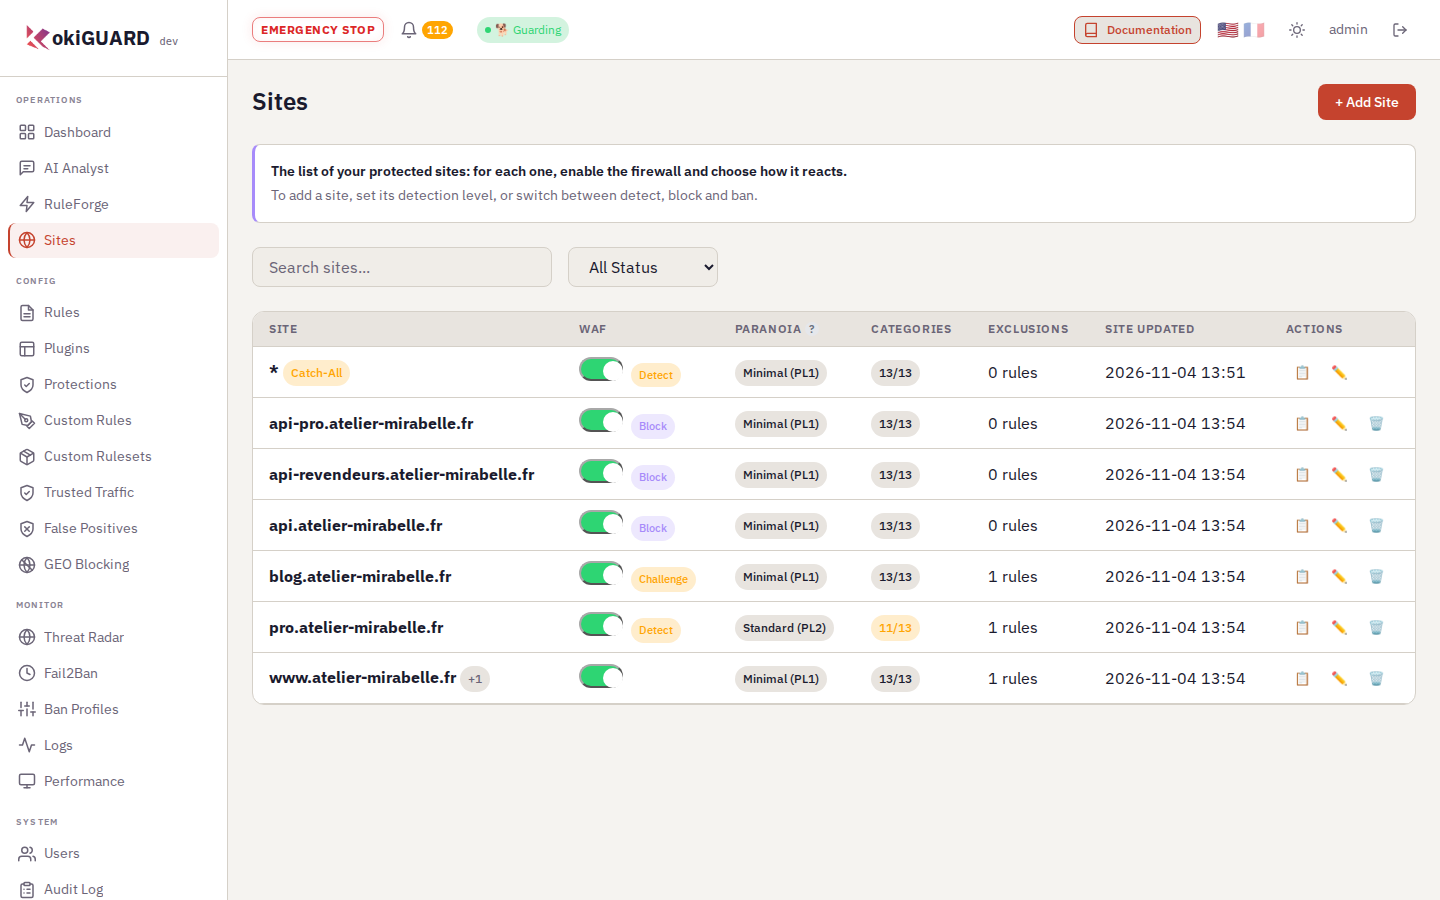
The list of sites. A badge shows a site in Detect, Block or Challenge mode; a site without a badge is in Ban mode. Here, the trade area is still in Detect: it is a site in its running-in phase.
| Column | Meaning |
|---|---|
| WAF | Switch of the WAF and active mode (Detect, Block, Challenge or Ban). |
| Paranoia | Severity level of the rules, from PL1 (minimal) to PL4 (paranoid). |
| Categories | Number of CRS rule families that are active on the site. |
| Exclusions | Number of false positive corrections specific to the site. |
It applies to each request whose domain name matches no declared site, for example a robot that calls the server by its IP address. In the forms, do not confuse “” and Global (all sites): a global rule applies to all your sites, a rule on “” applies only to these requests without a site.
- The sites hosted on the server appear automatically.
- A listed site is not necessarily protected: look at the WAF switch.
- Read the dashboard: what was blocked, by which rule, from which addresses.
- Recognize the status of kokiGUARD in the top bar.
- Find each site and know if it is protected, and in which mode.